Aug 12Aug 13Aug 14Aug 15Aug 16Aug 17Aug 18
GCI 001
GCI 002
GCI 003
GCI 004
GCI 005
GCI 006
Spectogram Calendar (currently available sites)
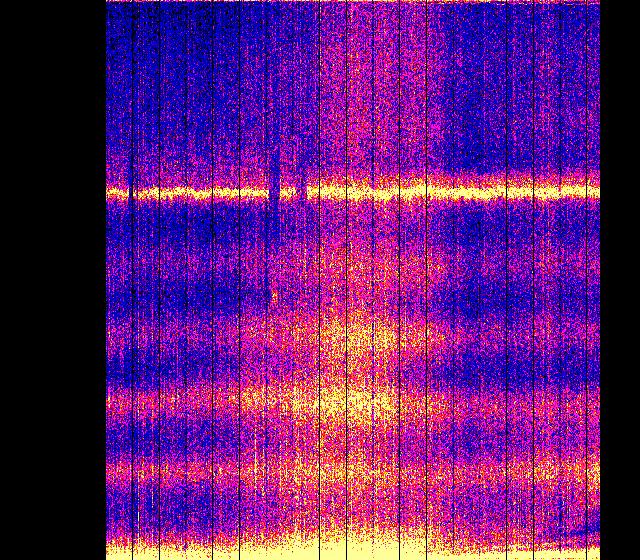
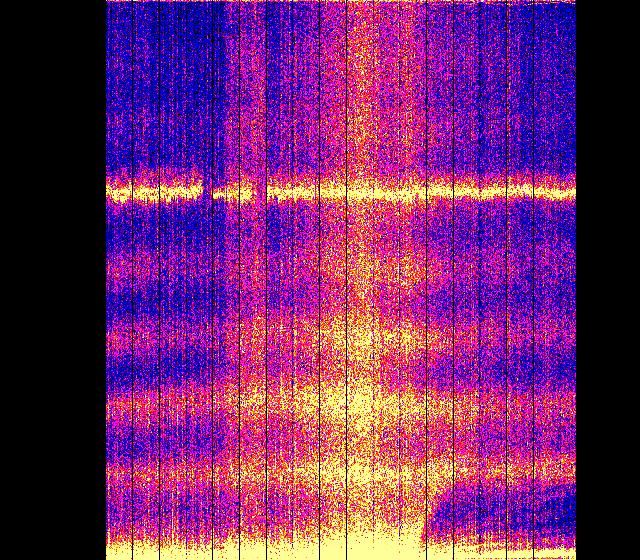
  • GCI001 California, USA
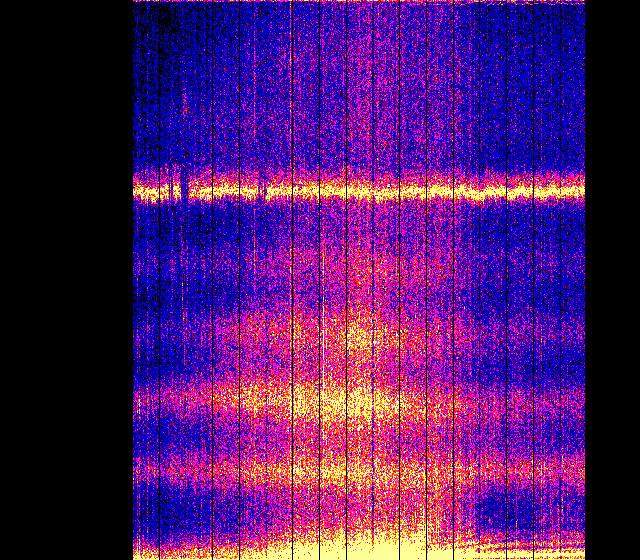
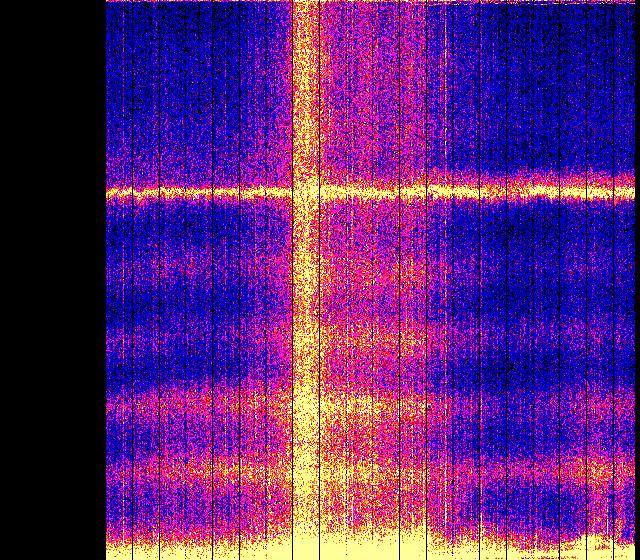
  • GCI003 Lithuania; GCI004 Alberta, Canada
  • GCI005 Northland, New Zealand
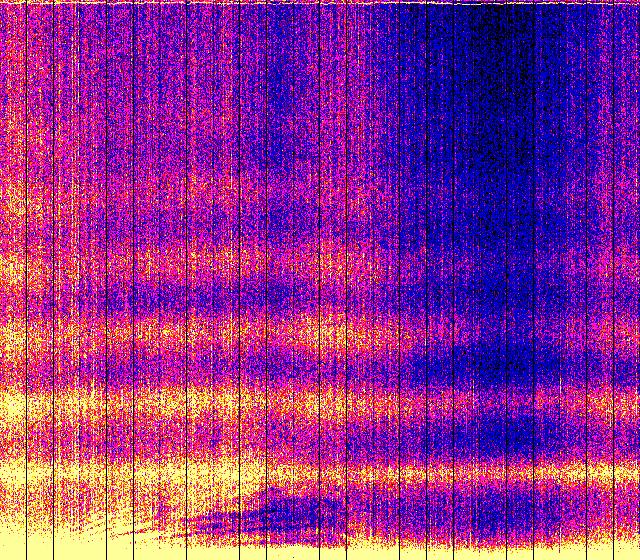
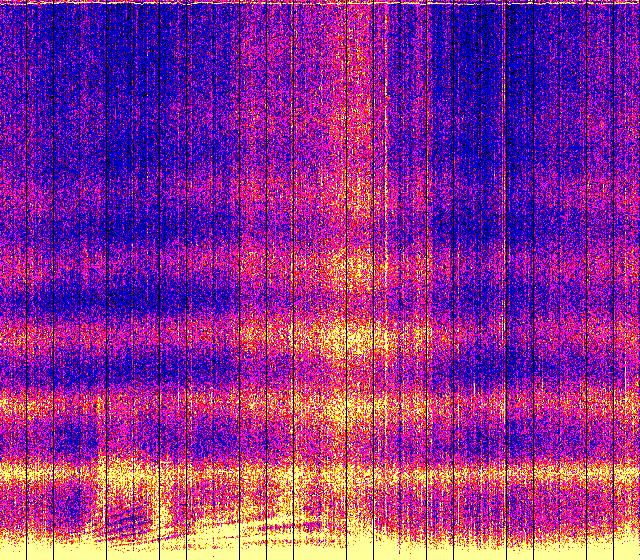
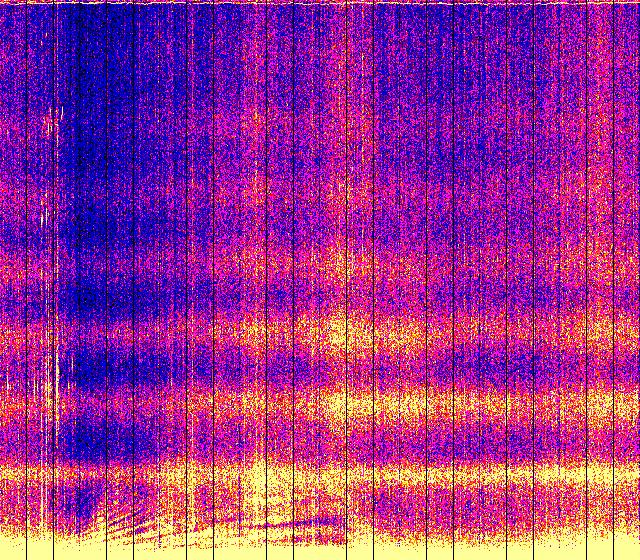
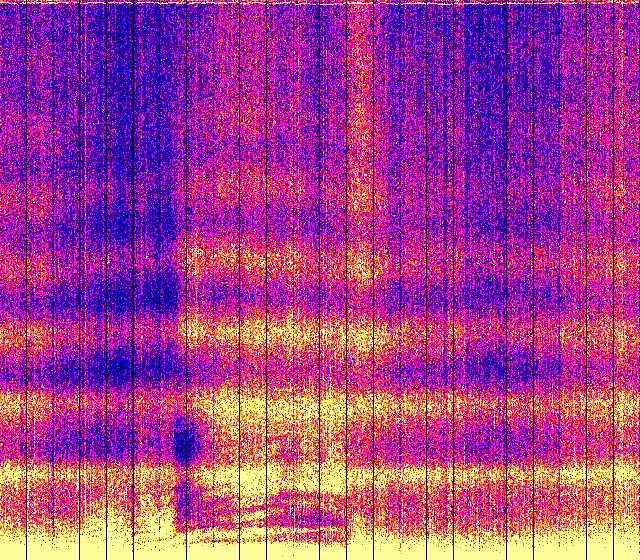
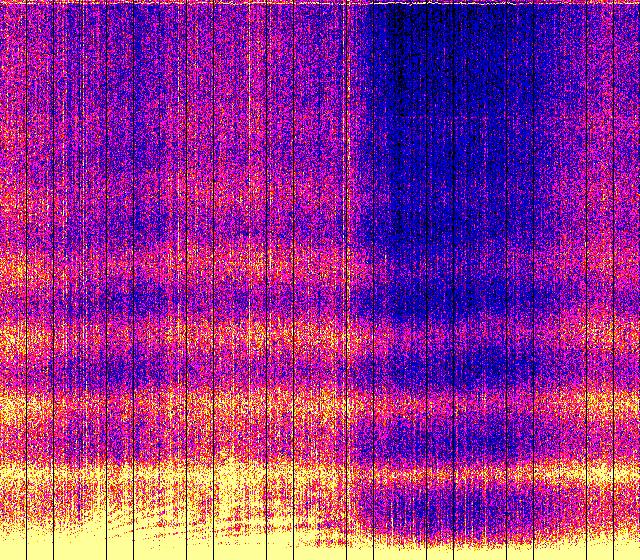
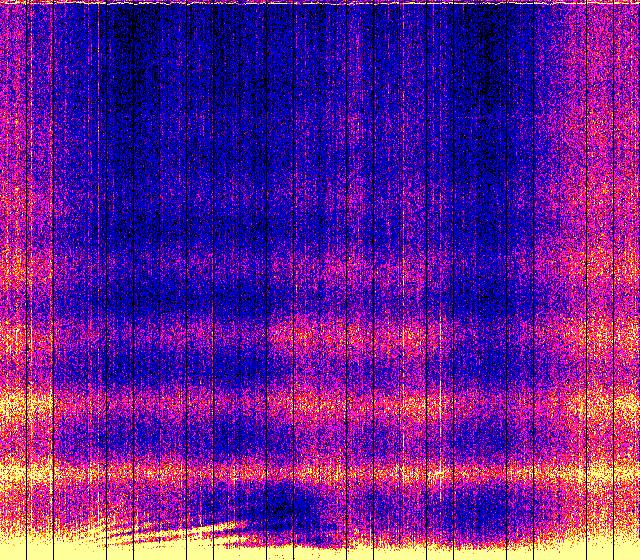
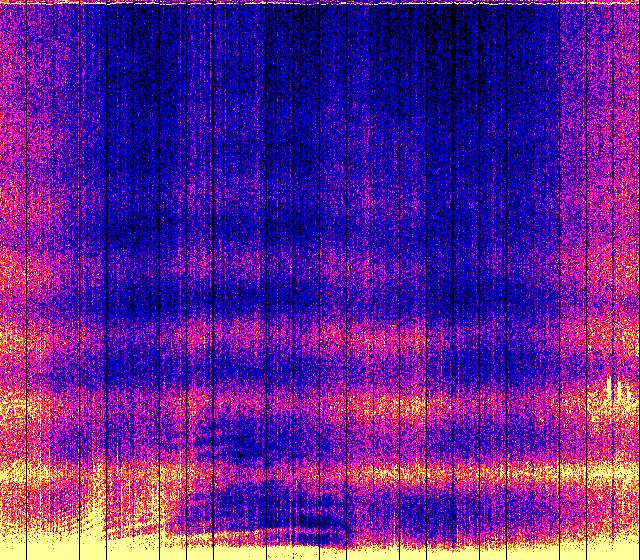
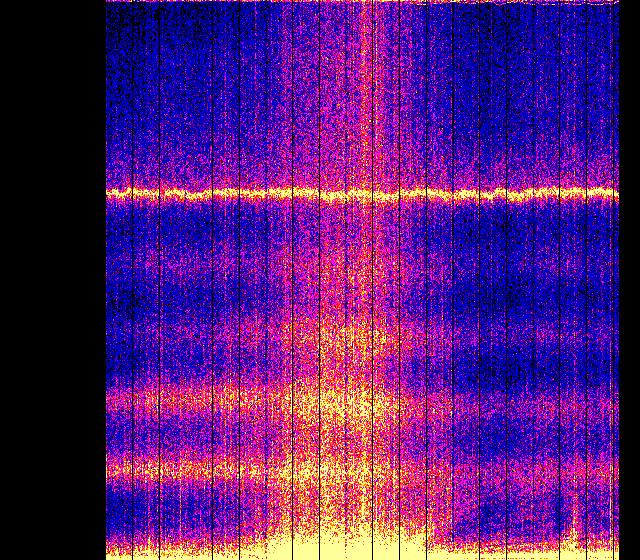
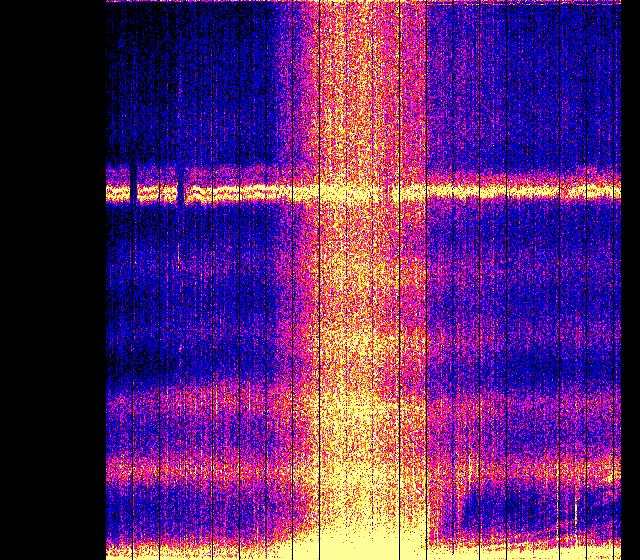
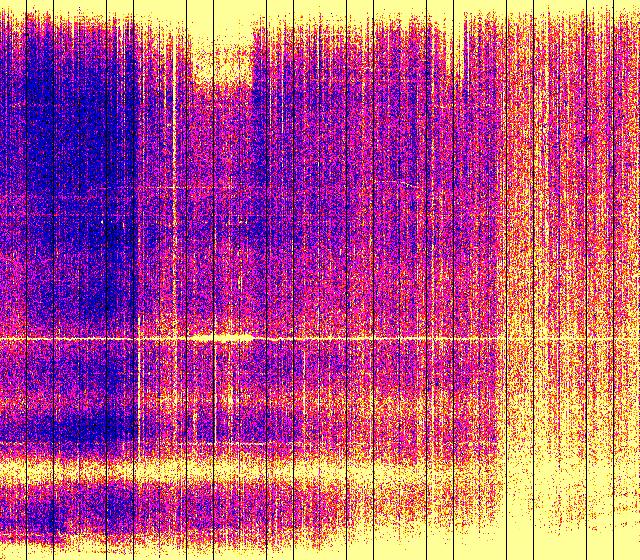
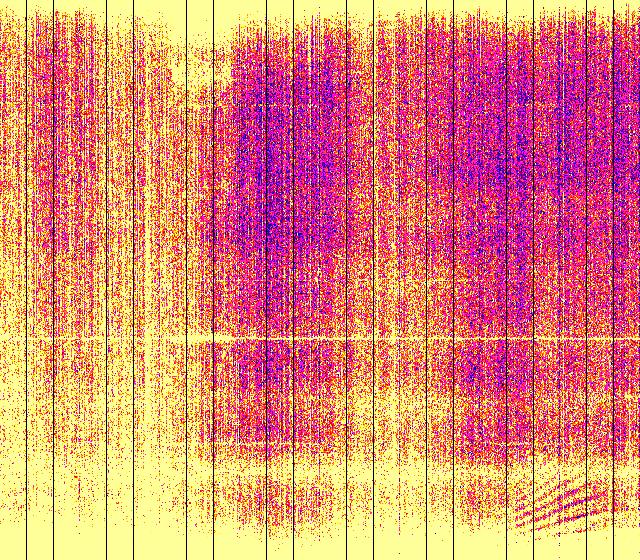
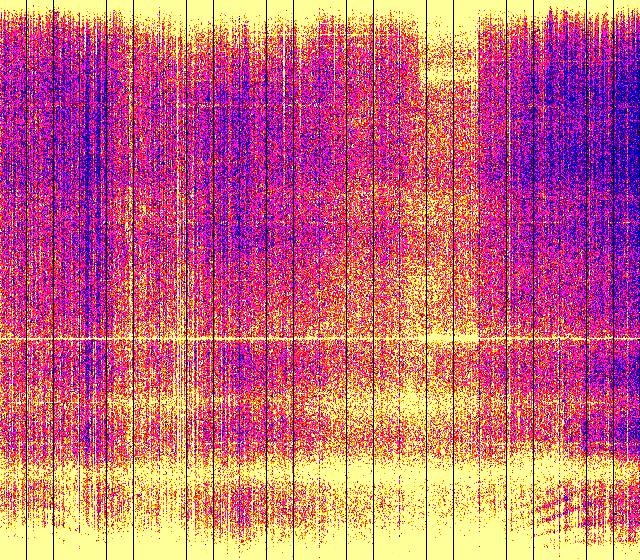
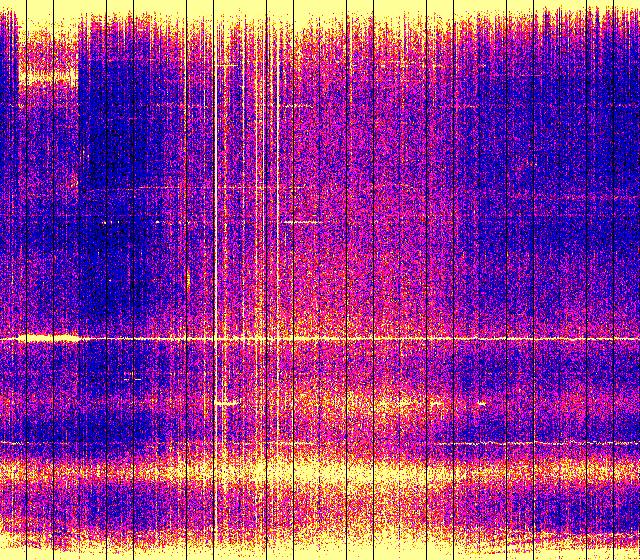
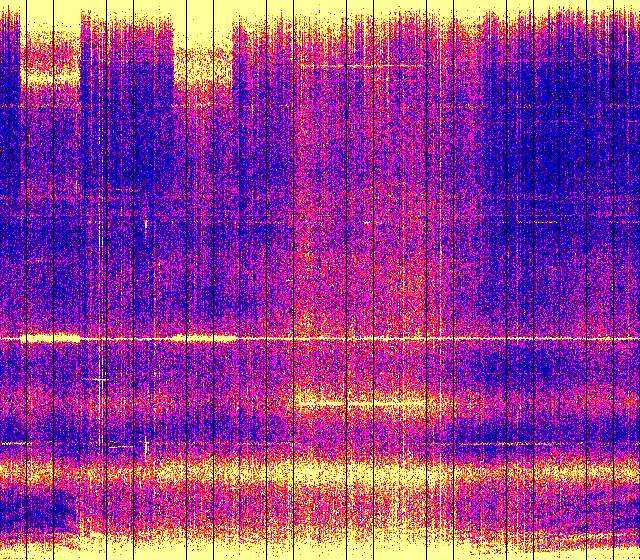
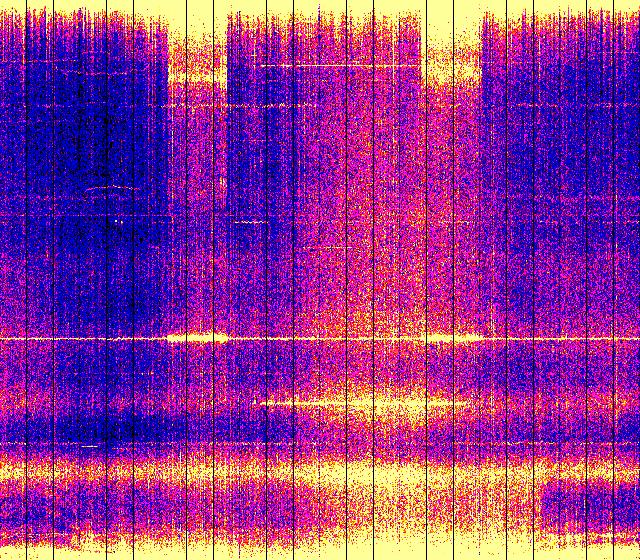
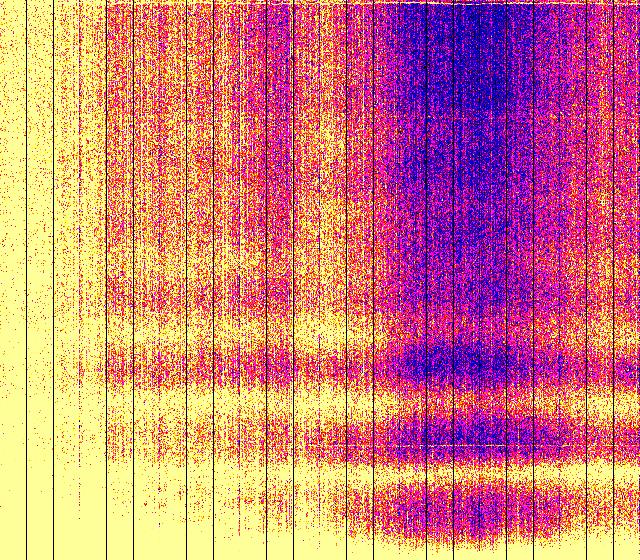
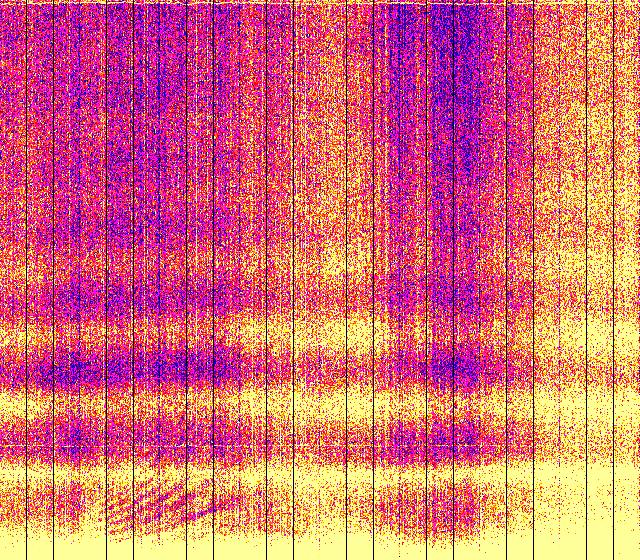
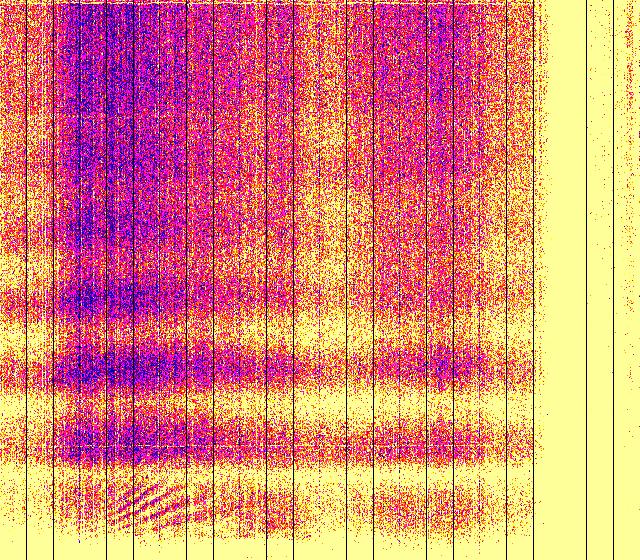
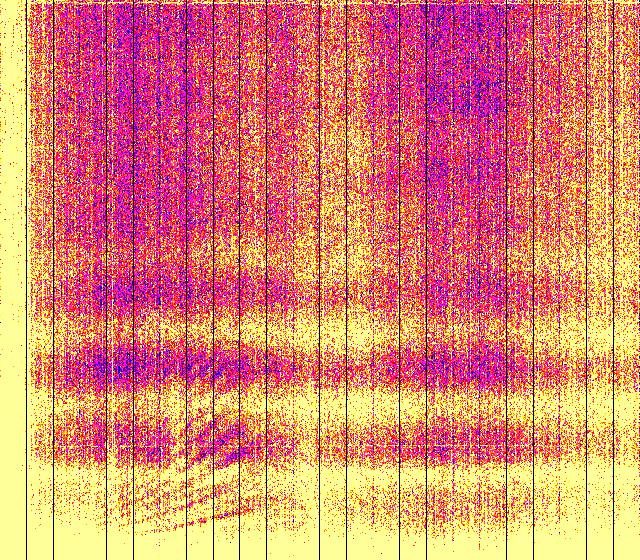
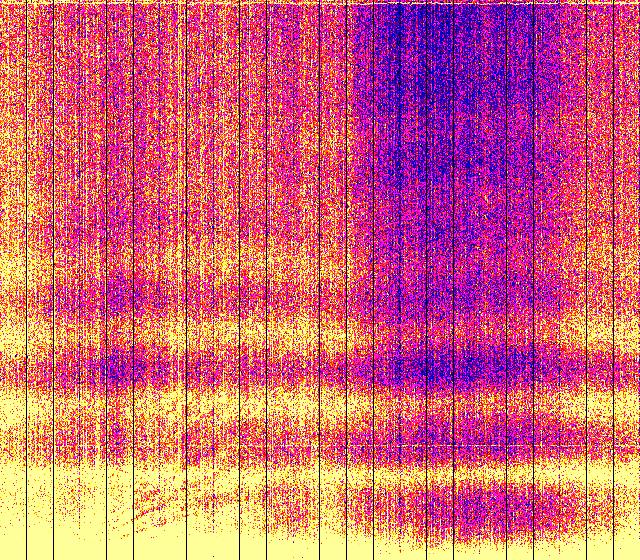
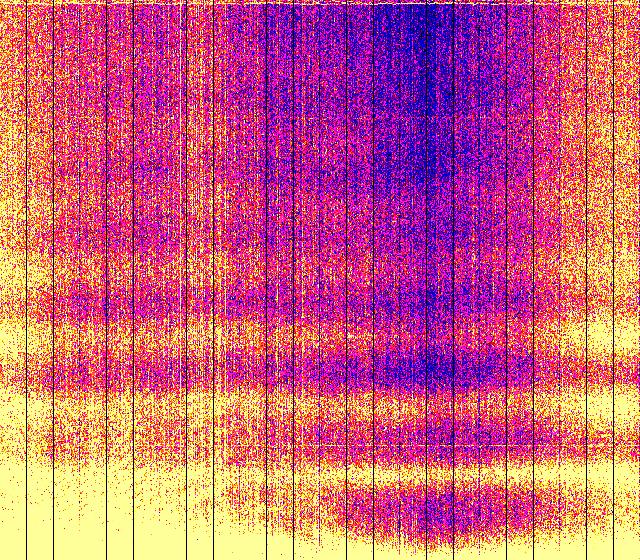
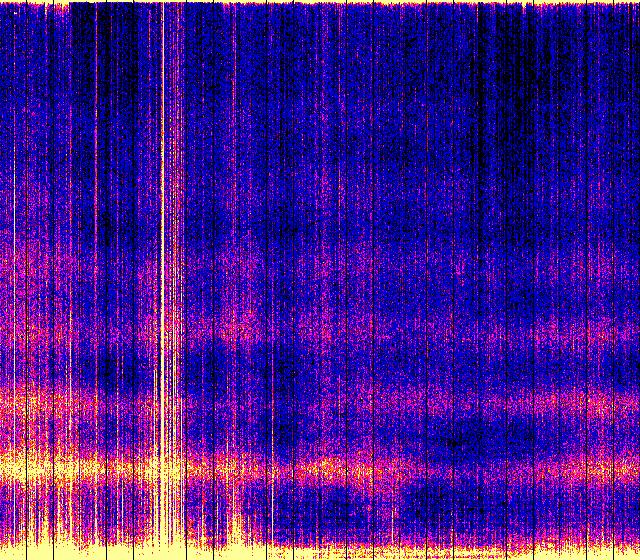
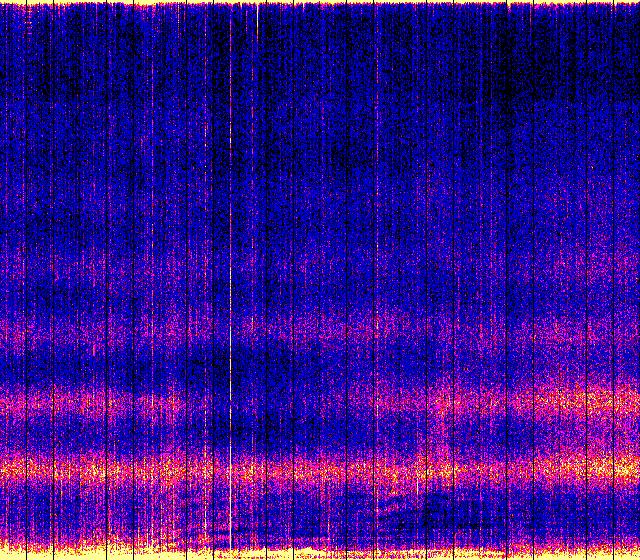
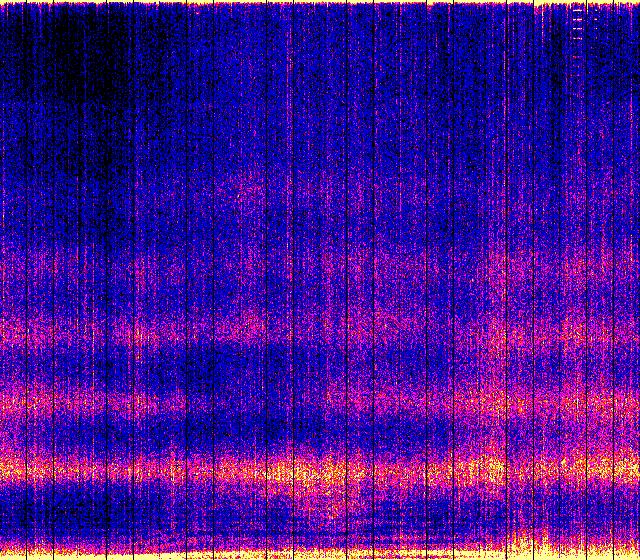
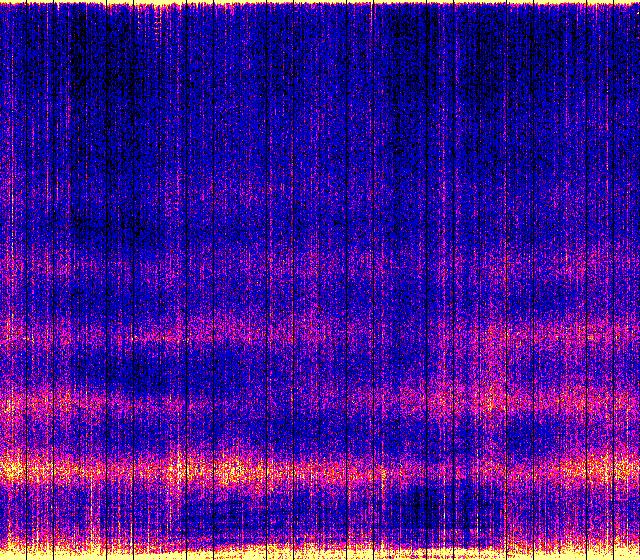
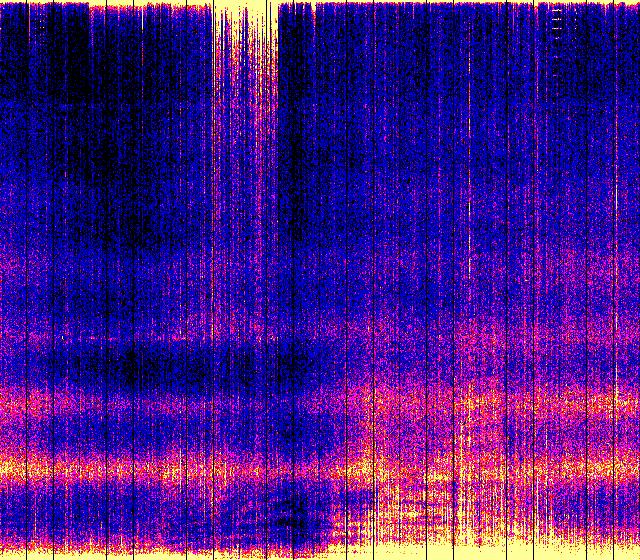
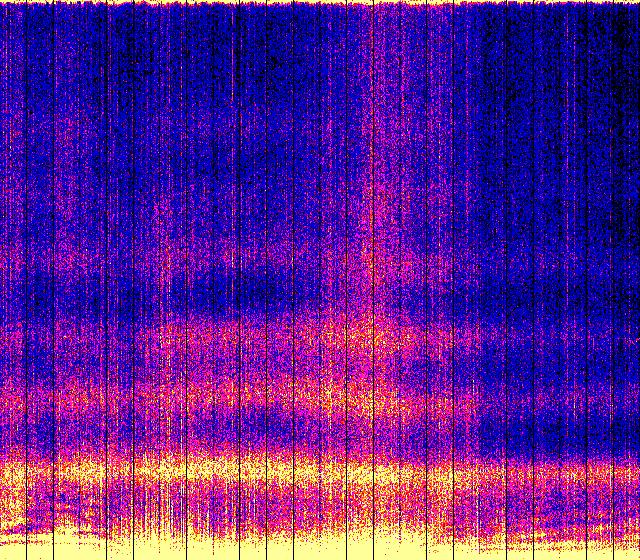
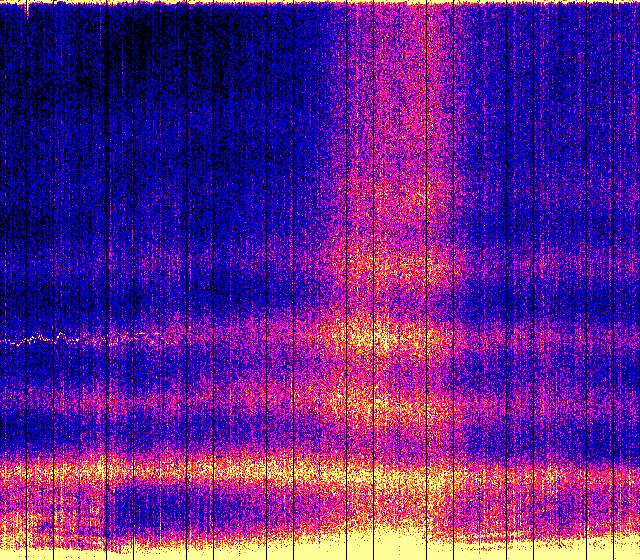
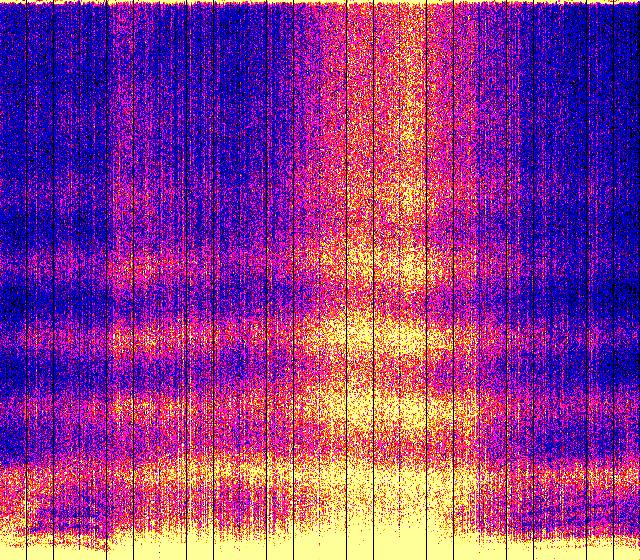
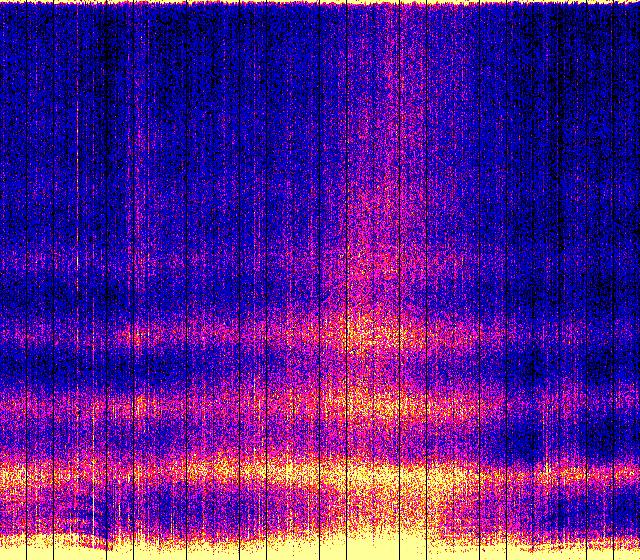
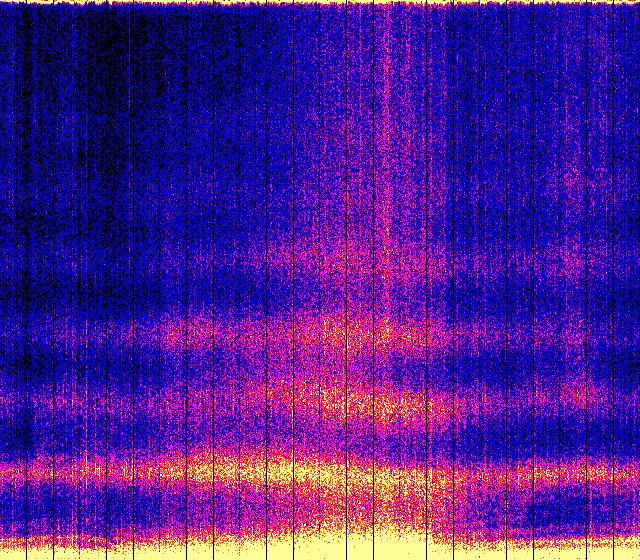
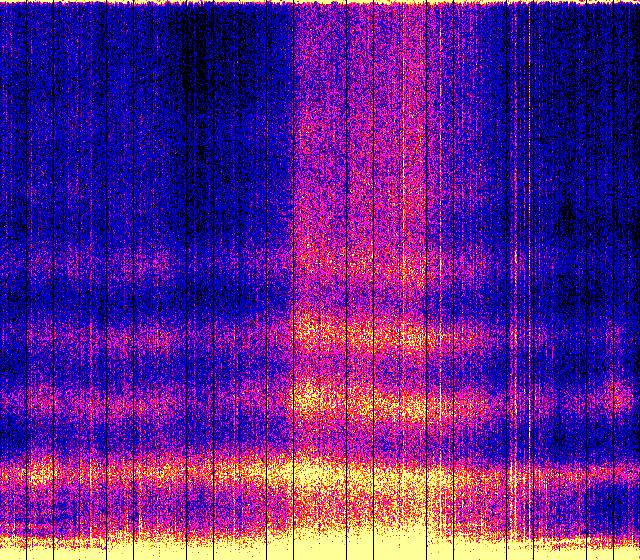
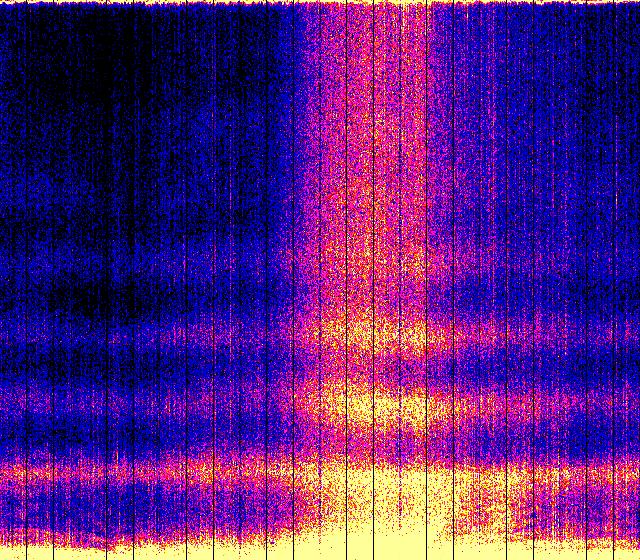
The Spectrogram Calendar displays data from the magnetic field detectors deployed by the Global Coherence Initiative research team to monitor the resonances occurring in the plasma waves constantly circling the earth in the ionosphere. These daily spectrograms show the activity occurring at the various resonant frequencies from 1 to 50 Hz. Within the spectrogram, the power, or intensity level of each frequency is displayed as a color, with yellow being the most intense. The Schumann resonances appear as the horizontal lines at 7.8,14, 20, 26, 33 & 39 Hz. In this calendar, each day begins at midnight UTC (Coordinated Universal Time).
Each row of images is from a different site location, new sites will be added as they become operational. Clicking on an image will pop up a full-size image of the selected day. Clicking the arrow buttons in the top left and right corners of the calendar will advance the page forward or backward one day < > or one week << >> at a time.